This page is about salinity and the development of our knowledge of it , especially as relevant to the Wimmera.
Salinity is an environmental problem that can be hard to grasp, … until it is too late! Across much of Australia, our farmlands are potentially salty lands. But, when land was being cleared for farming, this was not known. It was known in W.A. in the early 20th C., but development went ahead.
How salty does it get? e.g. at Jeparit on the Wimmera River
Jeparit Waterwatch has been monitoring the Wimmera River through its swamplands to, and including, the Lake Hindmarsh since 1995, under the Waterwatch program. By May 2015, Jeparit Waterwatch had 20 years of monthly data. They are probably Australia’s longest continuously running group to achieve this.
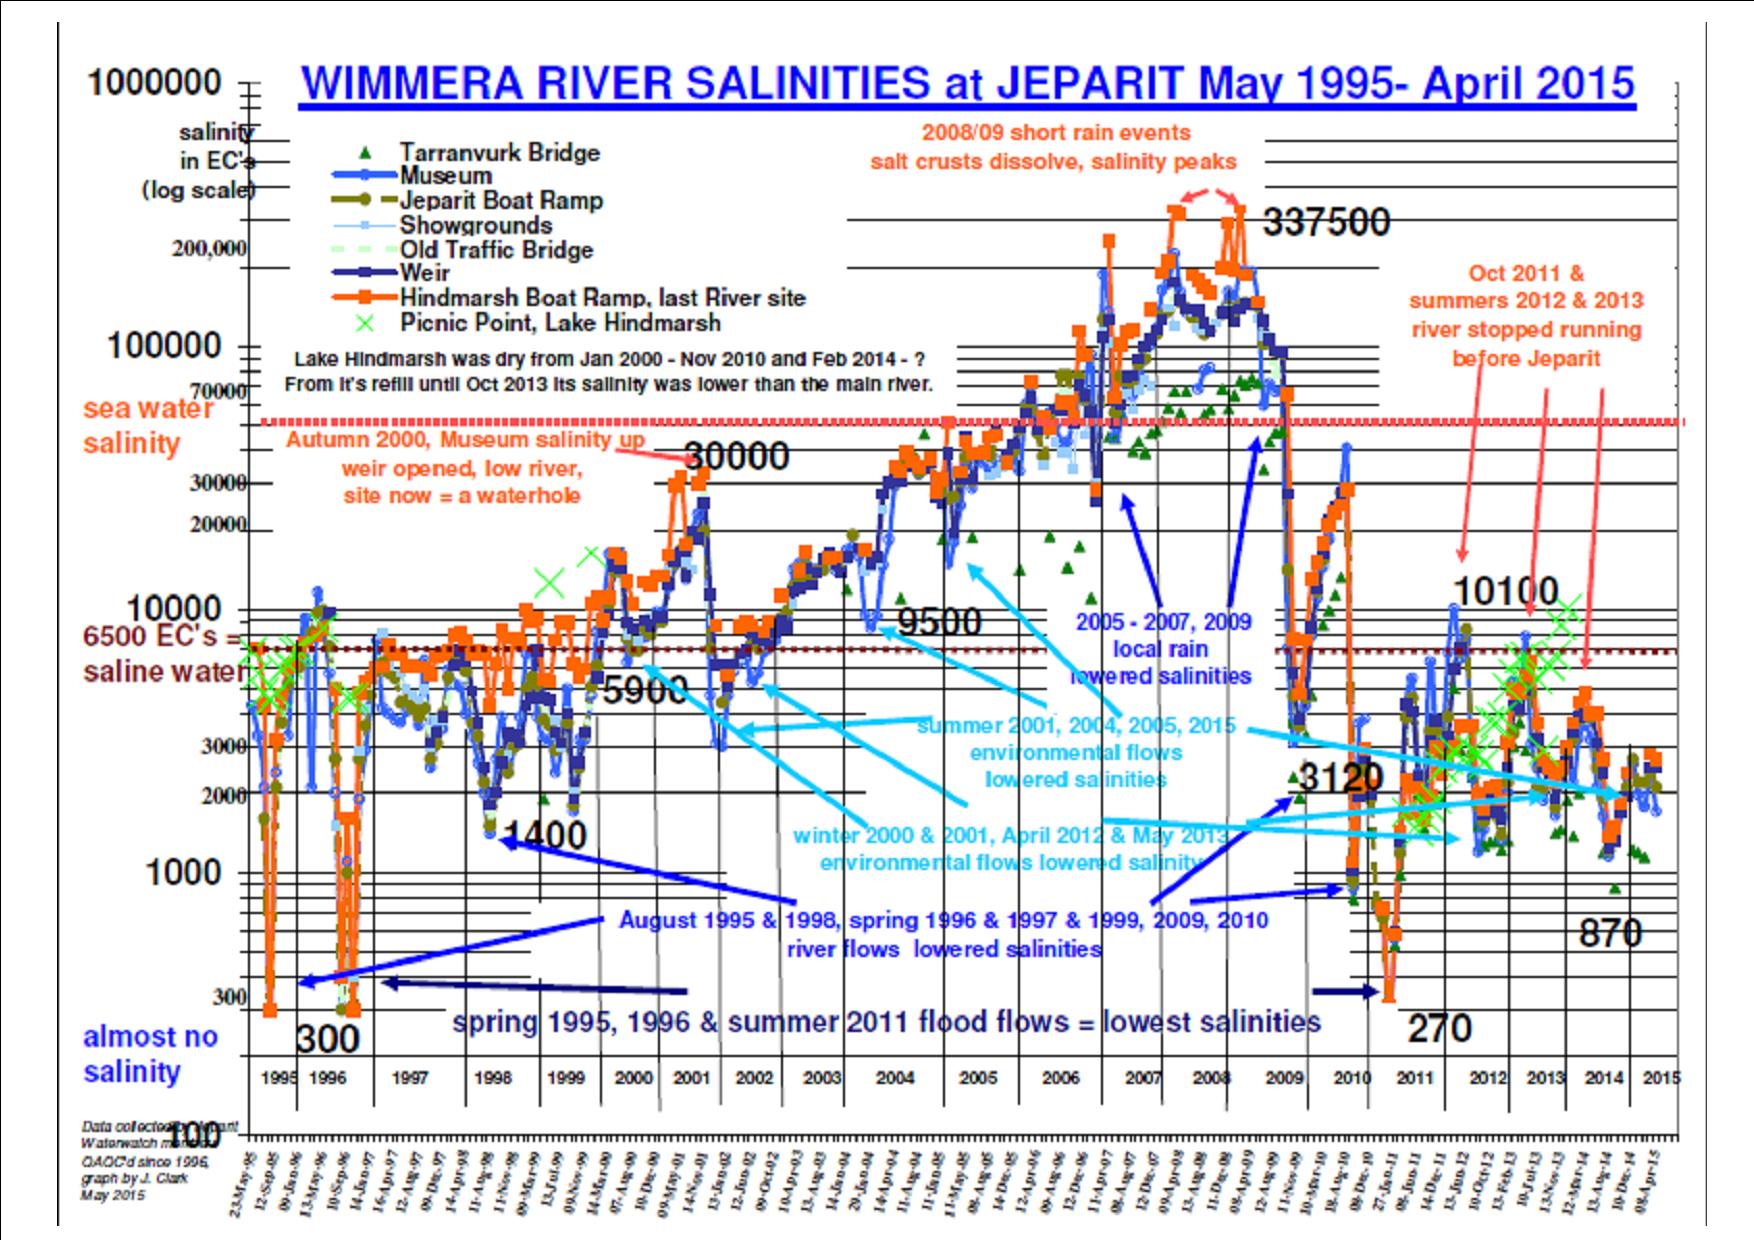 Their readings for these 2 decades cover 2 floods and the long decade of Drought. The River became much more salty than the sea, while it ran fresh water with the floods. (Click the graph to open it.)
Salinity has many other effects in the environment. Prolonged high salinities at Jeparit were accompanied by some unexpectedly Strange River Water Colours- browns, greens, blacks, reds. What other effects would you expect, especially on plants? Yes, our River Red Gum trees died.
Where did salt in the Wimmera Catchment come from? For a quick summary of the salty origins of the Wimmera-Mallee see landhistory.pdf at the St Joseph’s Primary School, Hopetoun STS 2012 resources webpage
Try this out –
1 Create your own sandpit model of the way the Lower Wimmera developed by following the Hopetoun landhistory.pdf.
How did knowledge of salinity develop over time?
Our knowledge of salinity, water quality and land has been evolving since the colonisation of this land begun. It is a sobering thought that the process and problem of salinity was explained correctly to the Royal Society of Western Australia in 1924 by Walter Wood. Complete land clearing continued and the problems of salinity went on to develop, despite his warning. It then took problems with soil erosion and salinity to lead to research and action so that at the end of the 20th Century, we had caught up with what Wood knew in 1924. Along the way, there is other landmark Science discoveries relevant to farming with the description of soils in the 1940s and the land systems in the 1960s , and salinity programs in the 1990s- 2000s.
National Science Week in 2013 has a schools theme of A Century of Australian Science . From a farming perspective, what areas of Science are important? Knowledge of our soils and water, land capabilities and management of threats to it, and what can be grown? As a link to NSWk 2013, I have created this timeline for the development of salinity knowledge, with land and water, in 20 stages and set in the Wimmera where possible.A Journey of Discovery into Salinity Science
Try this out –
2 Create your own illustrations from my Salinity Science timeline above
Monitoring Water – Science at the local level
Community monitoring in the Saltwatch (since 1987) and Waterwatch (1995-2009) programs in the Wimmera provided salinity knowledge at a local level. Done with reliable equipment and procedures, they provided information about water quality which could be used for on -farm management decisions, thus contributing to sustainable farming, though it was not called that then. As the Wimmera went into severe drought in the 2000’s , the quality, then quantity, of the channel system dam water declined. For several years, local community monitoring showed that the water on farm was not good for use in farm gardens, while it was still ok for stock use.
In 2013, enviroed4all is running the Saltwatch program at several schools. For our farming communities, it will be the first opportunity for Saltwatch since the pipeline/tank system was completed in 2010 replacing the channel/dam system. Schools participating will provide a good coverage of the water quality that is now on farm in this lower Wimmera Catchment to see how things have changed.
Try this out –
3 Visit the Saltwatch website to load a map and see how salinity varies across the state and over time eg compare drought years with wet years.
4 Find a local contact to do Saltwatch testing near you.
This page is still under construction as the Saltwatch sessions in the Wimmera is taking place through May.
page updated 13 May 2013, 13 May 2015
supporter of
 and
and 