This page is to show how to use of drawings for recording Science. It uses landscape features as an example and suggests a method that covers observation, line drawing with/out labels and with/out a key and a statement about what is observed.
Drawing for Recording Science
Drawing has long been a method of recording Science, often called Natural History in past times.
So how do we use drawing for Science rather than Art? When a drawing is done for Science, it is done to record what is there. So, it’s:
- how the drawing is done, and
- what is recorded with it
- who did the record, where and when it was done
- labels for features
- description about the observations
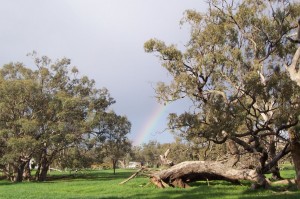
Let me use this scene to show how it can be done:
1 Carefully observe the Science in the scene – look to see which of some of the features on the What’s in an environment page are here.
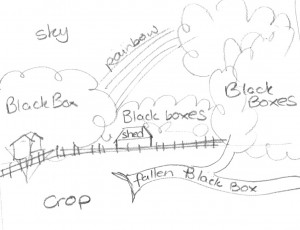
2 Do a line drawing first
3 Draw the horizon first! You may also want to draw a border to limit the size of the drawing.
4 Look for major shapes and sizes. Use symbols in the drawing. Labels can be added. Don’t stress yourself by trying to make it Art!
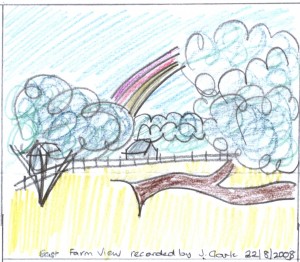
5 When you are happy with the recording of the scence, you can then look at how it looks as a drawing. You might want to add black texta or biro to outline it, colour it, if that is an advantage. If you want to trace it, try putting a clean sheet of paper over it while holding them both against a window.
6 Finish it off by ruling a box around it and putting where it is, your name and date it records.
- Finished drawing to show key features of farm environment
7 If you don’t have labels on the drawing, make a key for it. Below is a key for this drawing, as an example.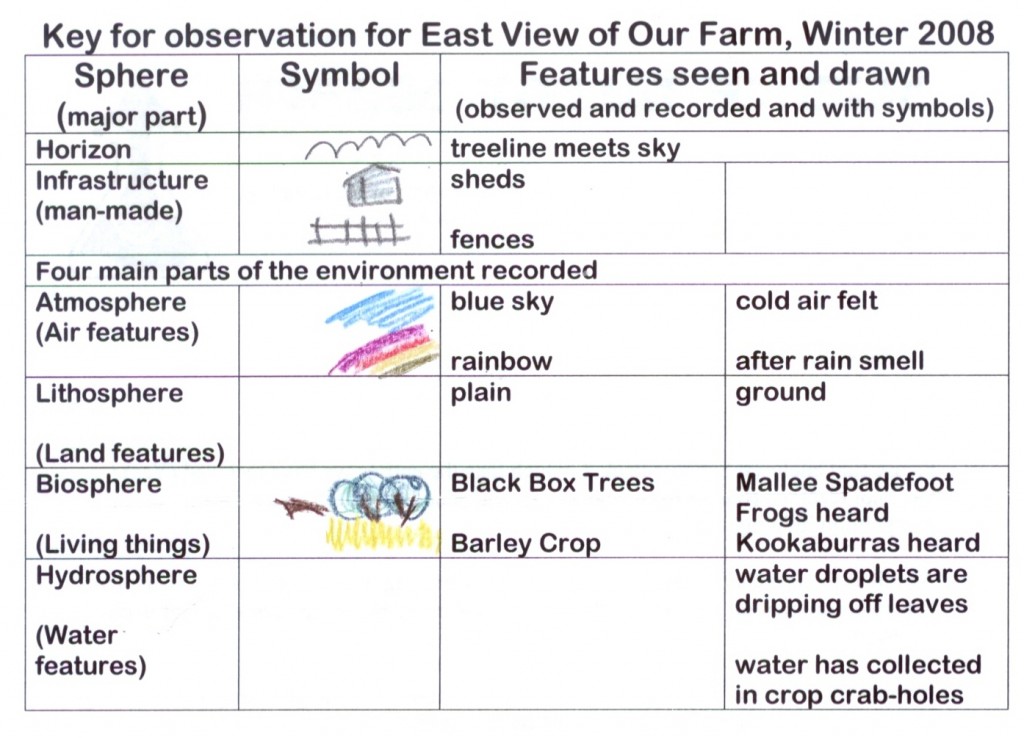
- The key for the drawing makes it part of a Science report.
8 The reporting is about telling others what you have found out. What would you put in a report? A scientific report should include the all the observations, but putting them into groups. In this example, it might be reporting how many features were in this landscape for each sphere.
There were seven physical features that could be seen at this distance: two of the atmosphere, one of lithosphere and two of the biosphere. Using hearing, there were two more features of the biosphere; using touch, one more, and smell one more. Looking up close, there were three more features. This meant there were 12 natural features and two man-made ones in this winter 2008 Wimmera farm landscape.
Your report might look different to this, just check it covers all the data (observations) you have made.
Now you know how to use drawings for Science. Enjoy using your drawings. You can add labels and keys to photos too, in the same way. … And of course, you can also use these for an Art Project too, if you leave the Science bits out!
This is a printer friendly version of this page Drawing for recording Science
This activity could be used as an education activity for the Australian Year of the Farmer and for the United Nations Decade of Biodiversity.
For more learning activities and refences return to 4learning main page
Page updated 15 Jan 2013
supporter of
 ,
,  and
and 